

MORGAN ROGERS ATTACKING MIDFIELDER
MATCH REPORT ASTON VILLA v CRYSTAL PALACE
Morgan Rogers was utilised as the central attacking midfielder, operating between Palace’s midfield and defensive lines. He looked to provide a forward passing option for Villa’s double pivot, receiving the ball and progressing play into advanced areas when space opened up. Rogers supported Ollie Watkins with runs beyond the striker, but was mainly forced to drop deep to link play and move the ball to wide areas. Out of possession he pressed aggressively from the front, aiming to close passing lanes into Palace’s midfield and set the trigger for Villa’s press. His most dangerous moment came when he drove into the box from a central position and forced a save early in the second half, but overall his influence was limited by Villa’s inability to sustain possession in advanced areas.
-
MINUTES PLAYED
-
90
-
GOALS
-
0
-
EXPECTED GOALS (xG)
-
0.11
-
SHOTS ON TARGET
-
1 / 1
-
ASSISTS
-
0
-
EXPECTED ASSISTS (xA)
-
0.03
-
PASS COMPLETION
-
67%
-
TOTAL TOUCHES
-
46
ASTON VILLA MATCHDAY SQUAD AND LINEUP

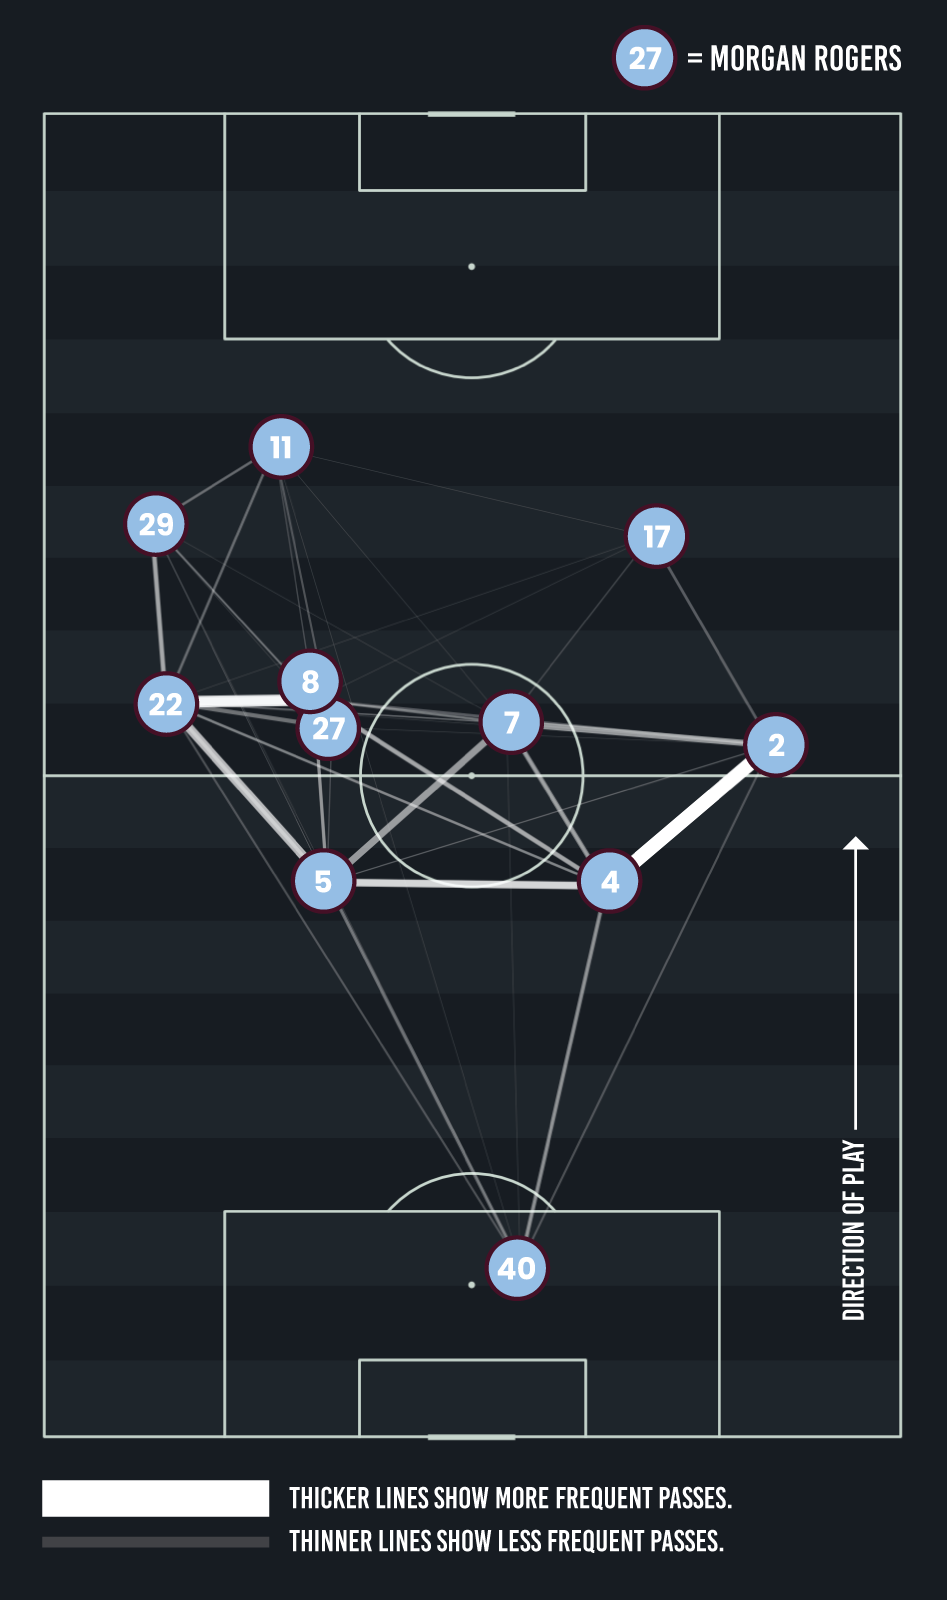
PASSING NETWORK AND AVERAGE POSITIONS
Morgan (27) was deployed as Villa’s central attacking midfielder but consistently dropped deeper to receive possession, often positioning close to the pivots and left-sided defenders.
While this gave Villa an additional passing option in build-up, it reflected their inability to progress through Palace’s press, with Rogers’ involvement largely confined to circulation in deeper zones.
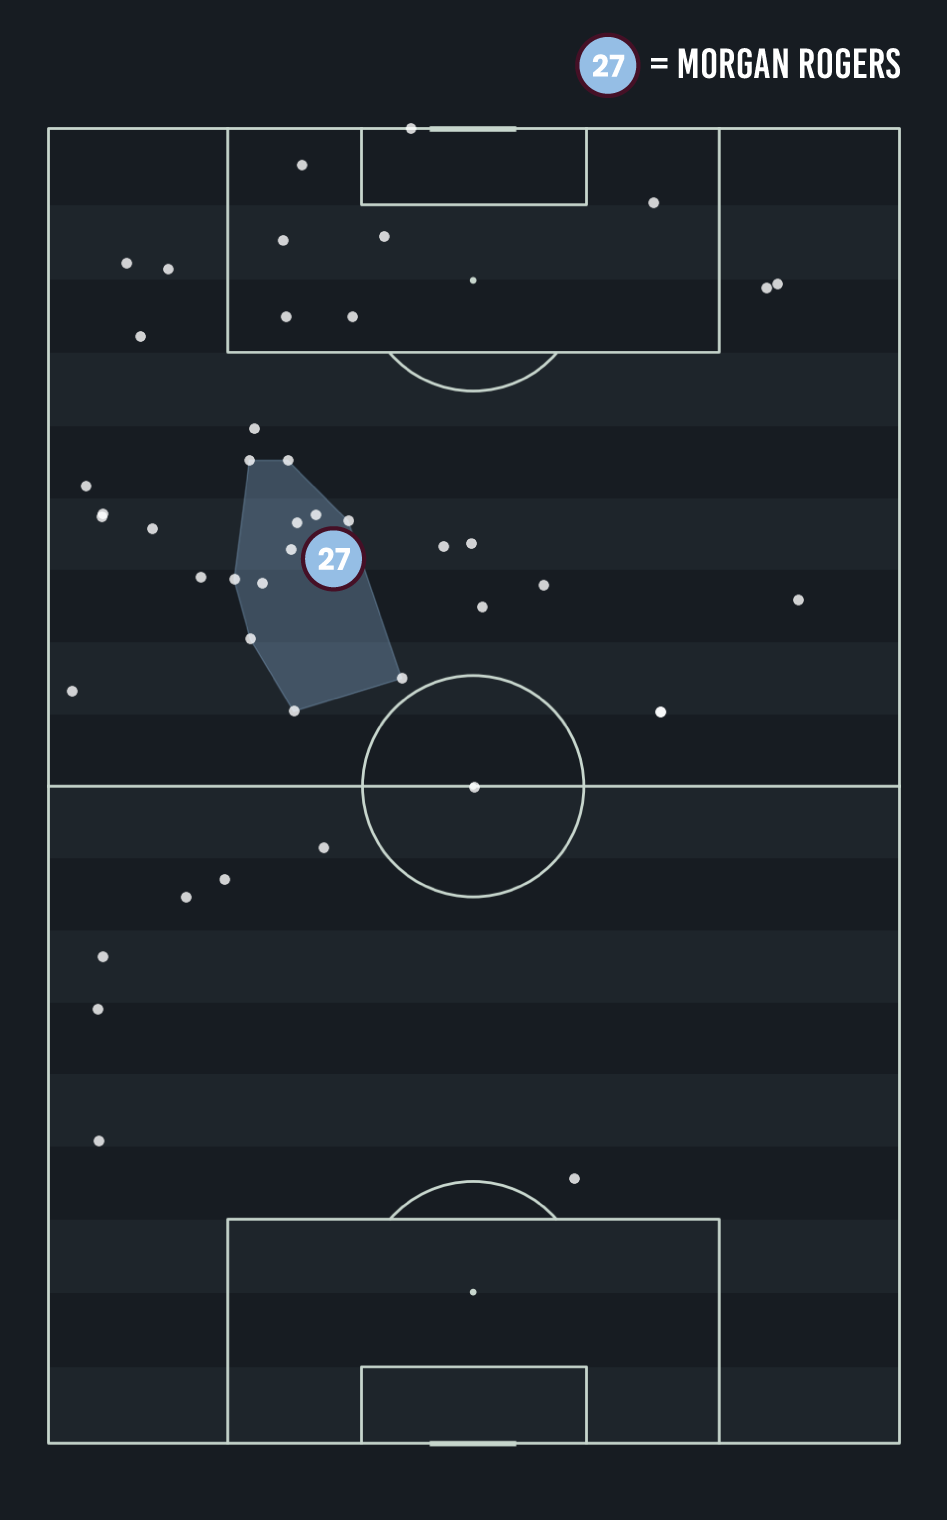
TOUCH MAP versus CRYSTAL PALACE
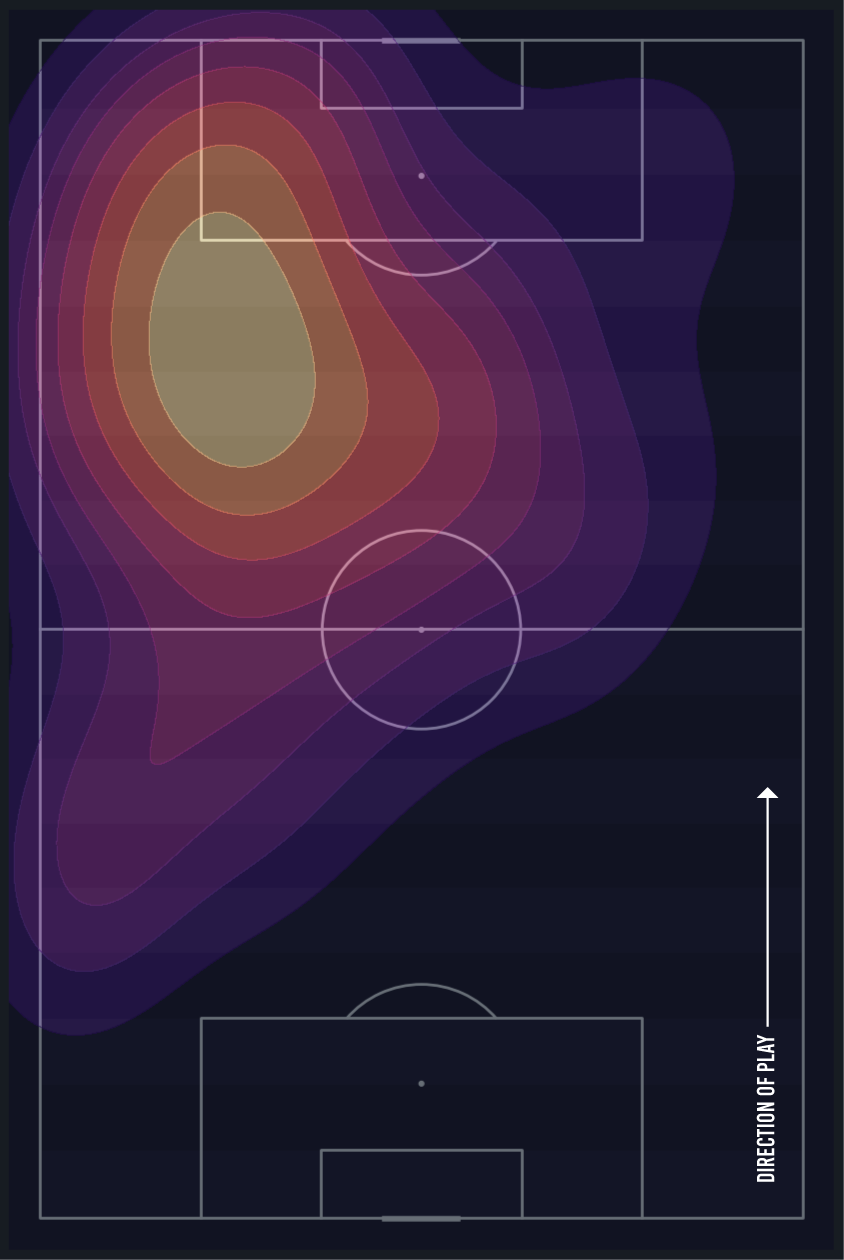
HEAT MAP AREAS OF ACTION
Morgan’s heat map shows most of his activity in the left half-space between midfield and the edge of the box, reflecting Villa’s reliance on left-sided build-up. He acted primarily as a connector in progression rather than consistently occupying higher attacking zones, with limited presence inside the penalty area more a result of Villa’s tactical setup than his individual positioning.
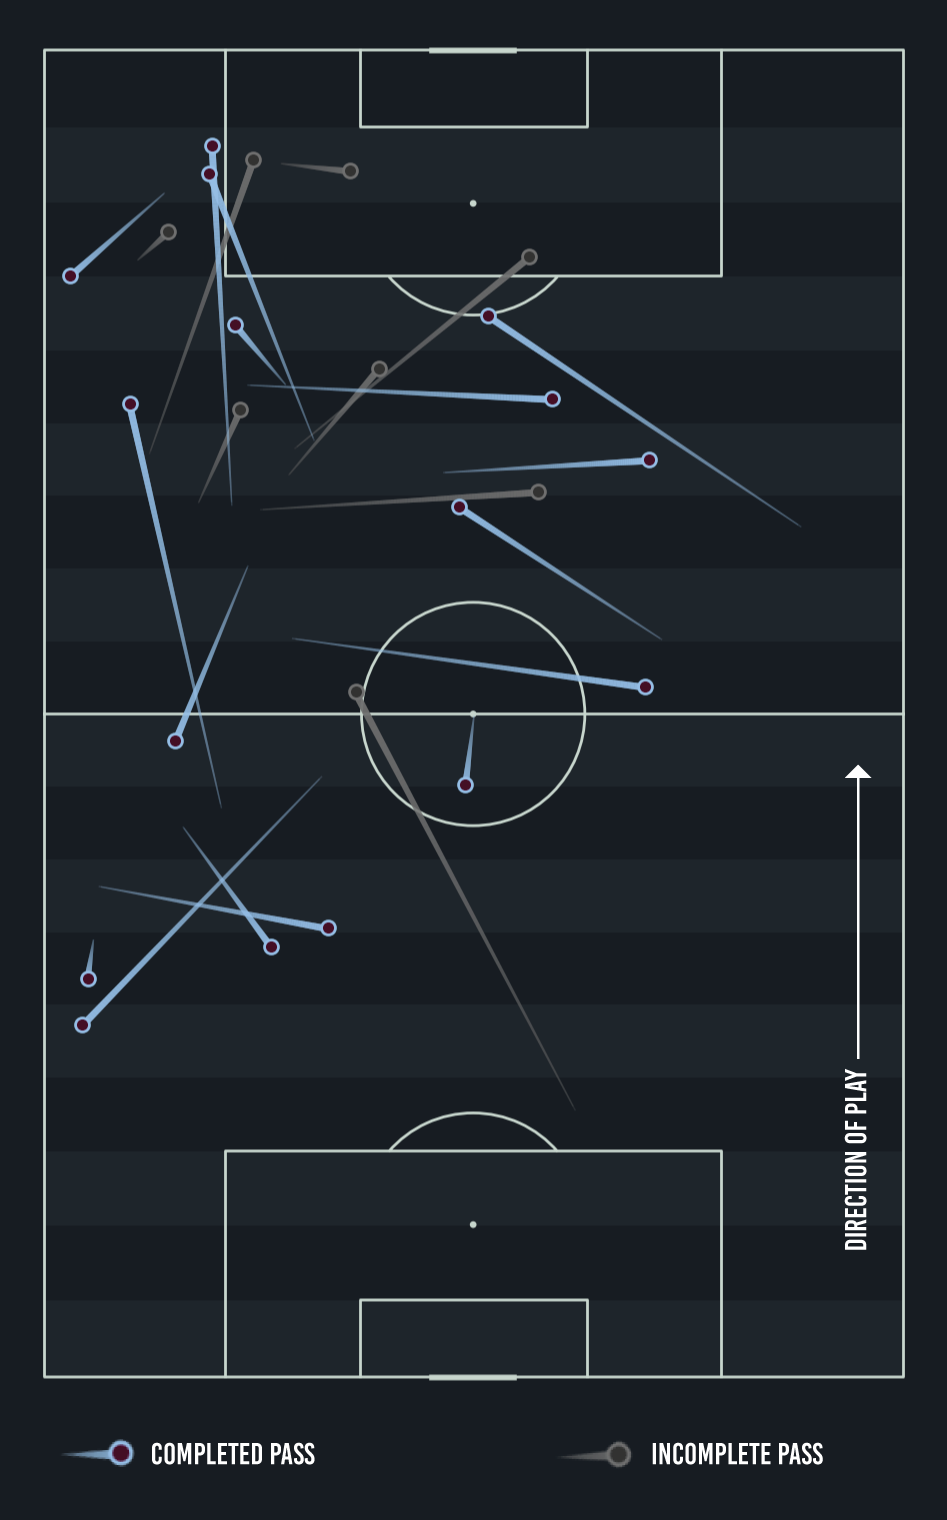
PASS MAP DIRECTION AND COMPLETION
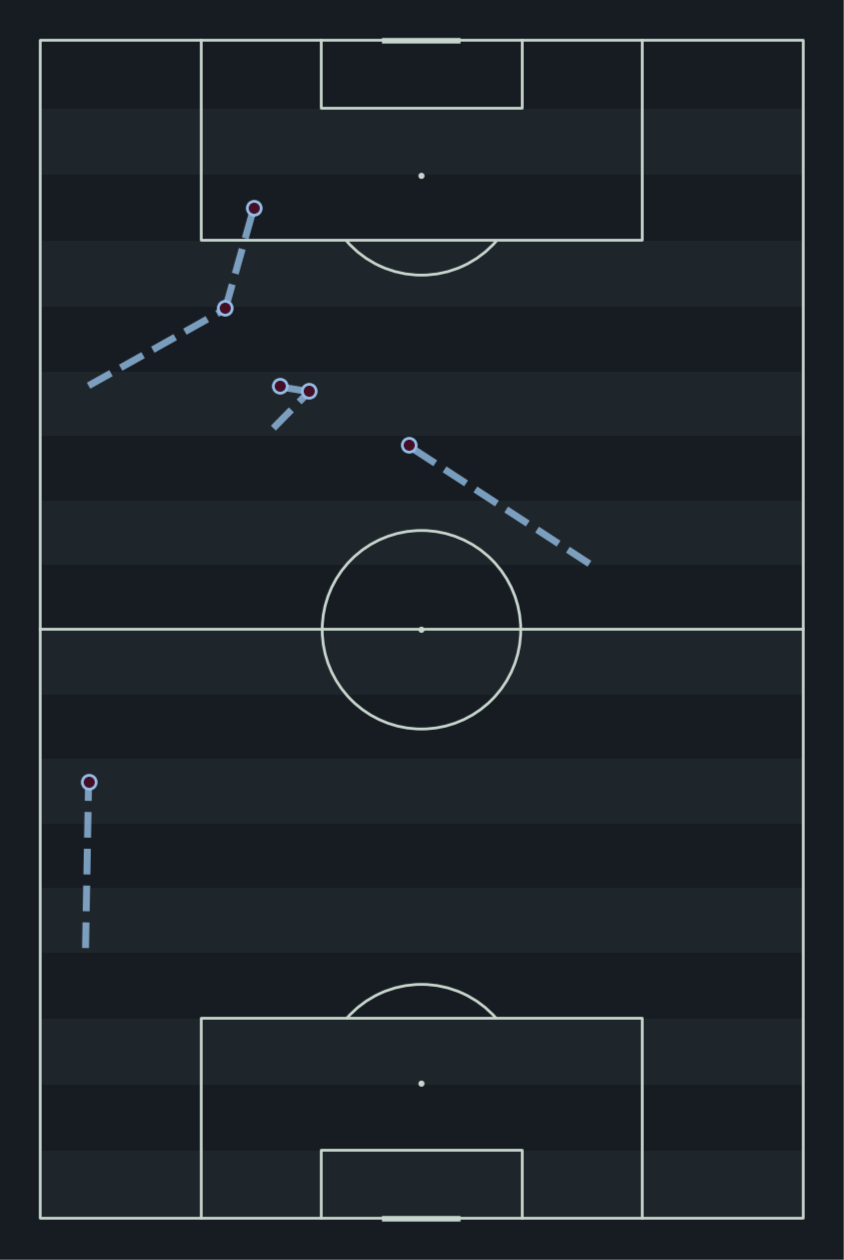
BALL CARRIES AND PROGRESSION
Morgan completed six carries, mainly through central and left-sided channels, including longer progressions from deeper areas. This underlined his willingness to take responsibility in advancing play, offering Villa a direct outlet when passing lanes were restricted.
However, with Villa unable to sustain attacks higher up, his carries largely stopped short of the box, reflecting collective limitations rather than a lack of individual drive.
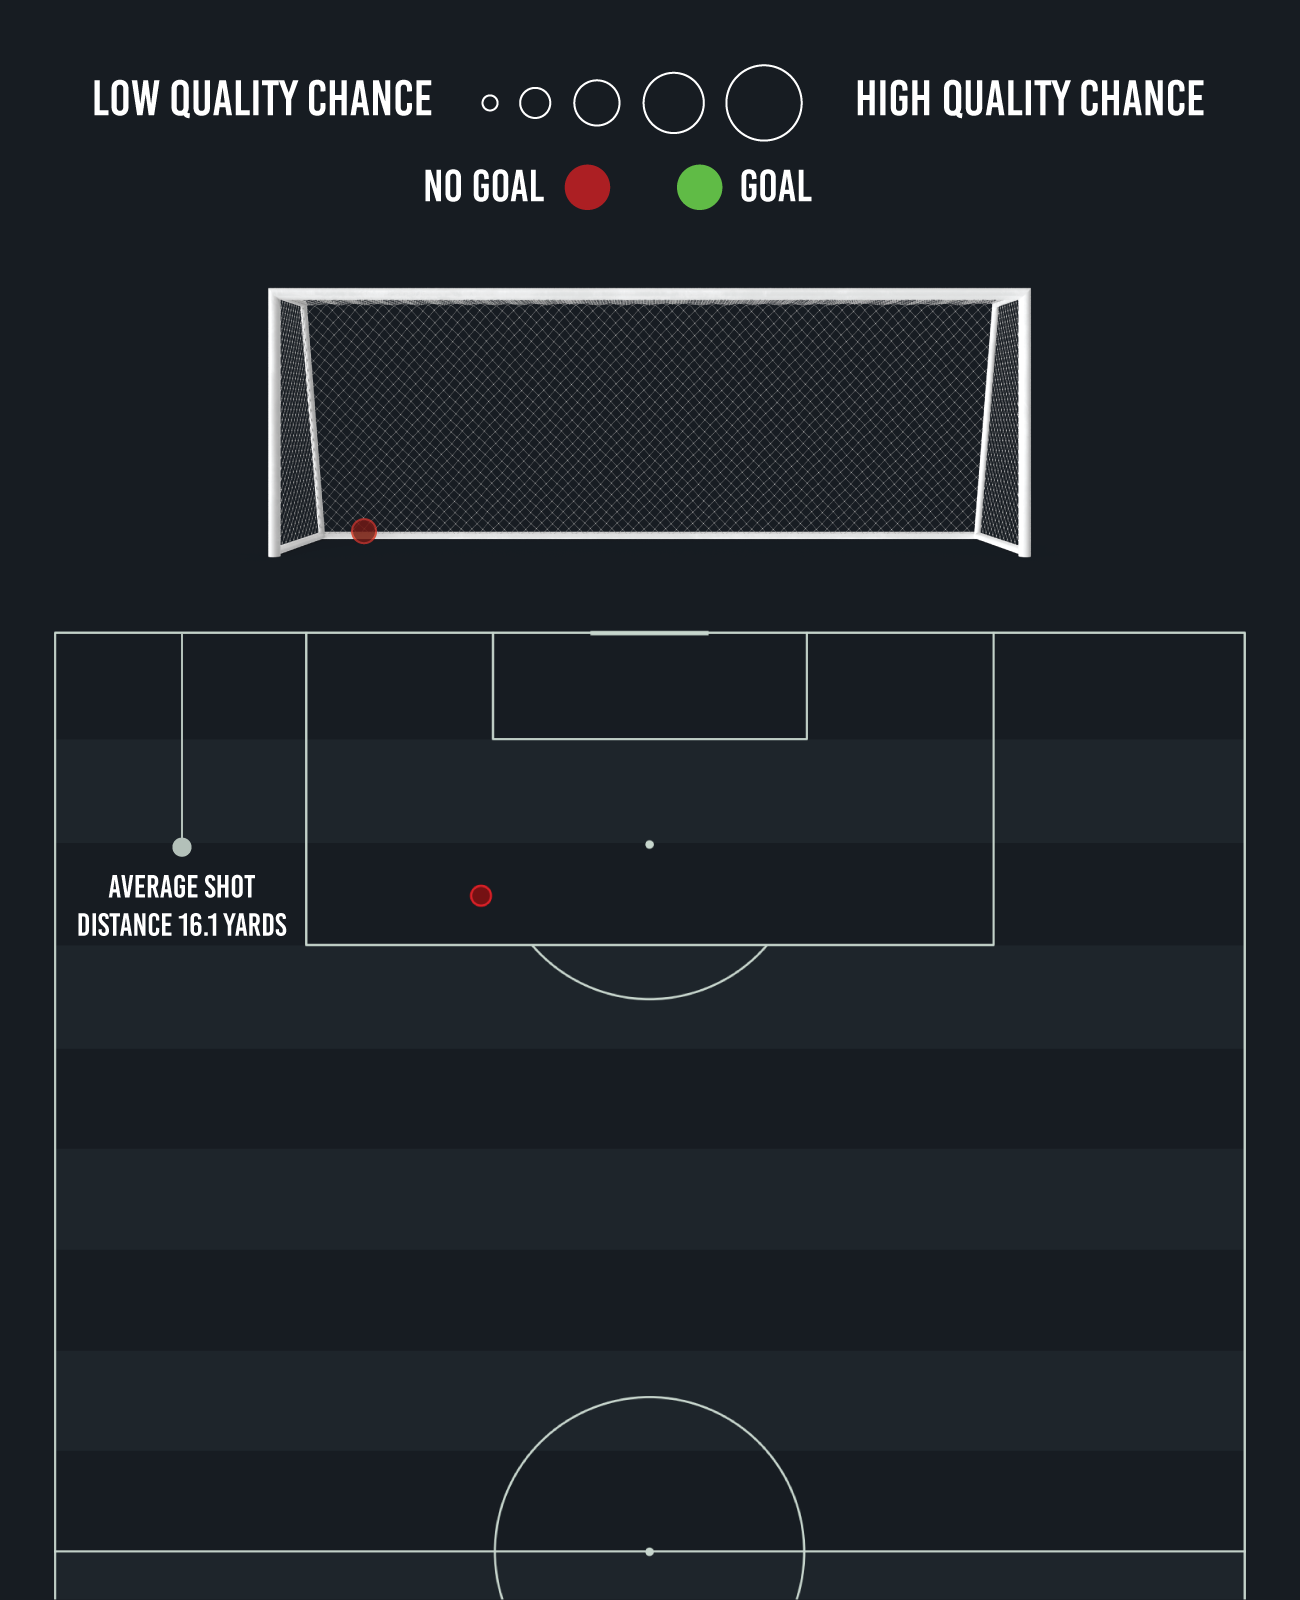
SHOT MAP versus CRYSTAL PALACE
-
TOTAL SHOTS
-
1
-
GOALS
-
0
-
NPxG
-
0.11
-
xG PER SHOT
-
0.11
-
RIGHT FOOT
-
1
-
LEFT FOOT
-
0
-
HEADER
-
0
-
OTHER
-
0
MORGAN ROGERS MATCH REPORT
Work with ScoutDeck® Get in touch with us now.
In today’s game, every transfer is a gamble—unless you’re armed with the right data. Our football data analytics risk management platform gives managers and technical staff a powerful edge when evaluating player signings. From performance trends to adaptability and long-term value projections, we turn complex data into clear, actionable insights. Make confident decisions, reduce costly mistakes, and build a squad that’s not only talented, but strategically sound. At ScoutDeck®, we know ball, so please fill out the form and we’ll be in touch to discuss your needs.

